
Metrics & reporting requirements
Identify the people using the information, the questions they need to answer, and the definitions behind each measure.
data analytics and dashboard development / Business technology
Data analytics and dashboard development for operational reporting, business visibility, and IoT telemetry. Define useful metrics and connect the data behind them.
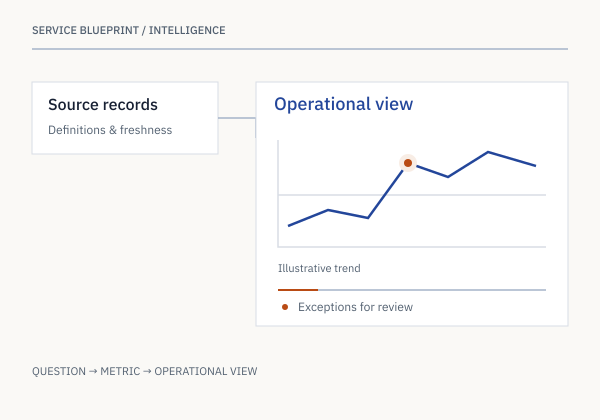
Source records feed an operational view of trends and exceptions. The chart is illustrative, not measured client performance.
The business context
Data analytics and dashboard development for operational reporting, business visibility, and IoT telemetry. Define useful metrics and connect the data behind them.
A dashboard becomes useful when people trust what it measures and know what to do with it. Begin with the decisions, definitions, and source systems before choosing charts or adding another report.
Where we can help
Shape the scope around your current environment, users, and the work that needs to improve.
Identify the people using the information, the questions they need to answer, and the definitions behind each measure.
Map source records, update schedules, transformations, and quality checks so the reported figures have a traceable foundation.
Build views that make activity, trends, and exceptions understandable. Include filters, useful comparisons, and clear indications of data freshness.
Connect device or application signals to operational reporting, with thresholds and alerts defined around the response the team needs to take.
CoreSoftTech’s published vehicle-analytics architecture connects sensor readings, a gateway, cloud data, and dashboards. That documented connection illustrates why data quality and integration matter before an intelligence layer is added.
Illustrative engagement model, not a client case study. Scope and delivery responsibilities are agreed for each project.
Illustrative engagement / Data analytics & dashboards
CoreSoftTech’s published vehicle-analytics architecture connects sensor readings, a gateway, cloud data, and dashboards. That documented connection illustrates why data quality and integration matter before an intelligence layer is added.
How we start
Bring your current environment and the outcome you’re working toward. We’ll use that context to shape the first stage.
Let’s find a starting pointClarify the business need, who the system serves, the constraints, and what a useful result would look like.
Review the data, devices, applications, and infrastructure involved. Identify dependencies before choosing the approach.
Agree on a focused scope, how the work will be evaluated, and the operational responsibilities that follow.
Before we begin
Analytics explains measures, trends, and exceptions using defined data and reporting logic. Applied AI may introduce model-based interpretation or conversational access. Reliable analytics can be a useful first step before deciding whether AI adds value.
The initial review should establish source access, record ownership, shared identifiers, and update timing. Those details determine how the data can be brought together and reconciled.
Agree on metric definitions, source ownership, transformations, and reporting periods. Document these decisions and include validation against known records before treating a dashboard as an operational reference.
The wider connection
U.S. presence / Since 2011
From Plainsboro, New Jersey, to Sunnyvale, California, we bring an established U.S. presence to your next technology project. Start with a direct conversation.
West Coast office
100 S. Murphy Avenue, Suite 200Let’s find a starting point
Tell us a little about your project and when you’d like to talk.